The population and housing forecast for the Mandurah region
Read forecast analysis and insights for the Mandurah region from Australia's largest independent population forecasting team.
Detailed forecasts are available for this region
Our premium services give you detailed forecast information for this region to help you invest in the right place, at the right time.
- Forecasts by age and sex
- Single-year forecast periods
- Custom local area geography
- Forecasts of housing and development
Menu
Read the insights and analysis behind our population and dwellings forecasts for the Mandurah region.
About the Mandurah region
Mandurah is a region in Western Australia’s South West. It includes:
- The LGAs of City of Mandurah and Murray Shire
- The ‘island’ townships of Halls Head, Erskine, Falcon, and Wannanup
- Mandurah city, a gateway to tourism in the region
- Pinjarra Alumina Refinery (one of the world’s largest)
Key findings
Growth in Mandurah North (medium term), superseded by Pinjarra (long term)
At the base year of the forecast period, 2021, the SA2 of Mandurah North was the most populous SA2 in the Mandurah SA4, with the most rapid development of dwellings, and subsequently, population growth. We predict this momentum to continue until 2031, and then gradually slow and eventually flatline as vacant land is exhausted in the area. From 2031, the Pinjarra SA2 will likely begin a rapid upward development trajectory, its population exceeding that of Mandurah North soon after 2041. These areas are the most illustrative examples of the general story emerging in Mandurah: that of land supply running out along the coastline, in and around the established centre of Mandurah, the momentum being quickly and competently picked up by the region’s east.
Out east too is the SA2 of Mandurah East, where the ERP is expected to more than double by 2046. While adding an extra 9,000+ residents, this growth however is nowhere near the 39,000+ residents to be added in Pinjarra, being geographically restricted by the Goegrup Lake and Black Lake, and the large lot sizes of the special rural zoning that prevails across much of the SA2.
In the west (the SA2s of Halls Head – Erskine, Falcon – Wannanup, and Dawesville – Bouvard), several small to medium sized developments are currently underway, however, there is limited medium to long-term development opportunity, restricted principally to larger residential lots along the Old Coast road. With this in mind, our forecasts assume a modest population growth for two of the three SA2s across the forecast period, and a steady population with a slight downward tail for Halls Head – Erskine. This minor decline is driven by very limited development in the long term coupled with the prediction of slight decreases in the average household size – a trend that will likely be present across all SA2s in the Mandurah SA4 except the major growth front of Pinjarra.
Mandurah’s story is also that of ageing, as all eastern SA2s age rapidly in the short, medium and long term, gaining population aged 65+ in absolute numbers as well as proportionally, adding up to 10 times the number of elderly when looking at 5-year age groups over 25 years (growth being most prominent in 80+ year cohorts as life expectancy rises).
What share of Australia's growth will occur in Mandurah?
Read our forecast results and analysis for Western Australia to learn more about how the different drivers of population change affect the distribution of growth throughout the state.
Forecast results
The following forecast information is for the entire Mandurah region.
Learn more about the different options to access these forecasts for Local Government Areas (LGAs), suburbs, custom catchments or the entire state or nation here.
| 2026 | 2031 | 2036 | 2041 | 2046 | |
|---|---|---|---|---|---|
Forecast population |
125,506 |
139,441 |
153,556 |
168,336 |
183,685 |
Change (five year) |
14,207 |
13,935 |
14,115 |
14,780 |
15,349 |
Average annual change (%) |
1.8% |
2.0% |
1.9% |
1.9% |
1.8% |
Forecast dwellings |
56,672 |
62,679 |
68,941 |
75,690 |
82,802 |
Change (five year) |
4,765 |
6,007 |
6,263 |
6,749 |
7,111 |
Average annual change (%) |
1.8% |
2.0% |
1.9% |
1.9% |
1.8% |
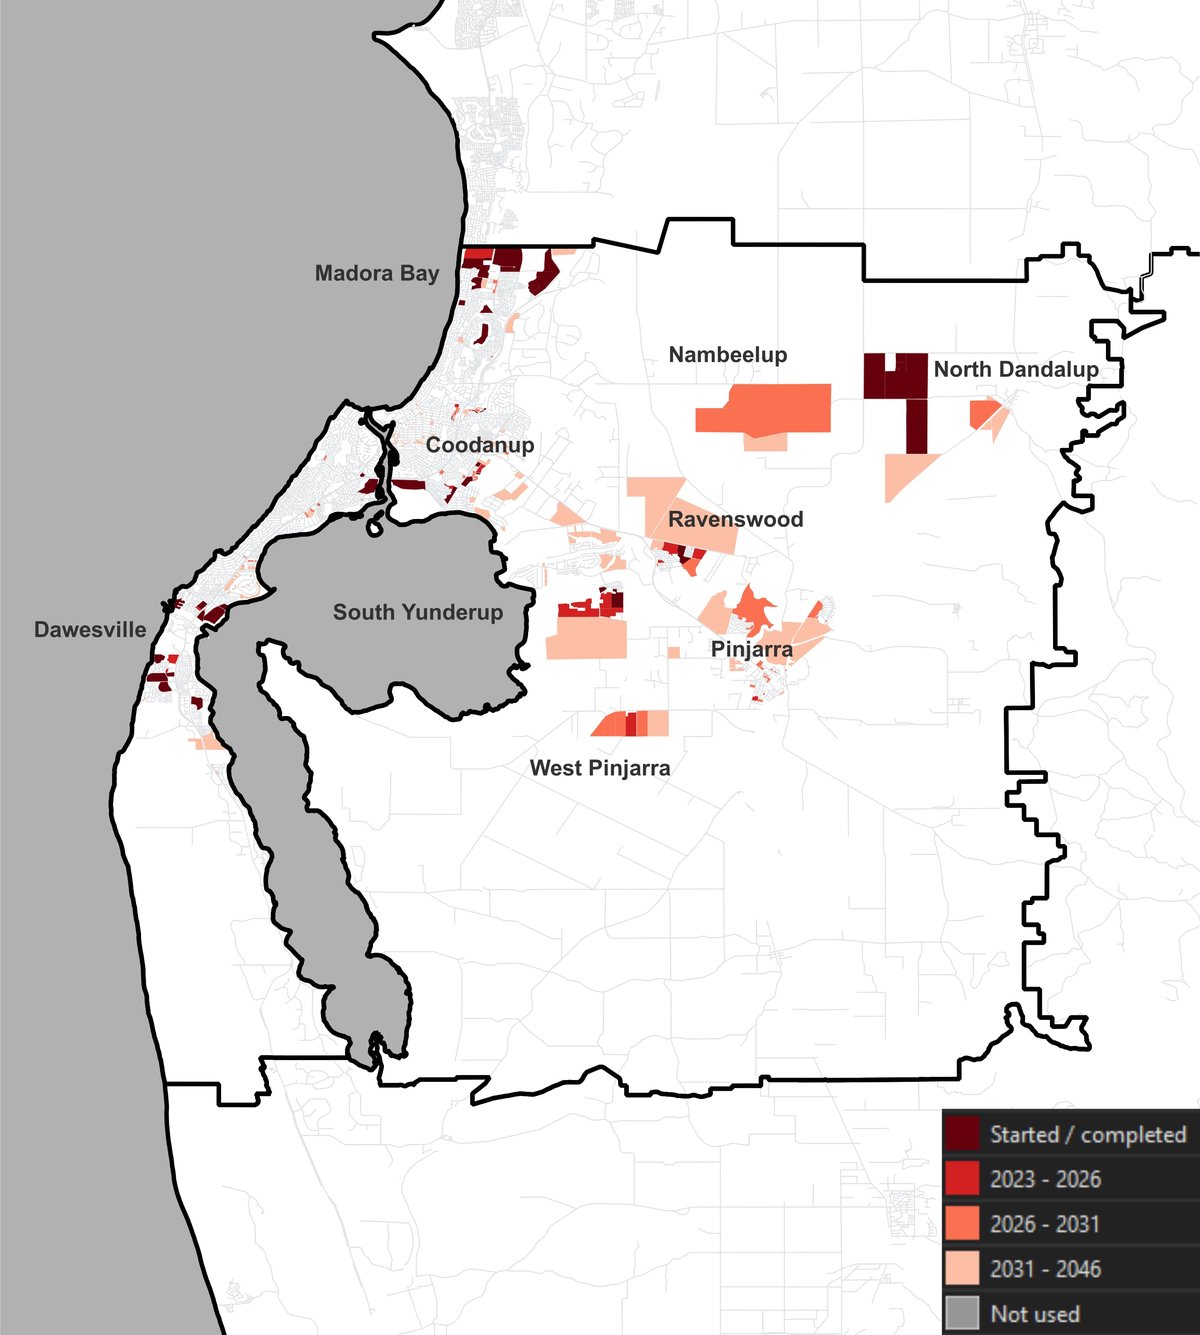
Map of development sites
The map below identifies all major development sites that have been identified in our research.
These sites have been organised to understand the likely location, capacity, timing and sequence of future development. By matching forecast population growth in this area to these sites, we can provide a more granular view of the distribution of the forecast population within a given region.
In the Mandurah SA4, we identified 281 development sites, 91.1% of which were used in the forecast period.
Learn more about our land use research →

1 national forecasting program.
6 ways to explore.
![]()
forecast.id
Plan for the changing needs of your community with a trusted forecast of population and housing in your Local Government Area, published in an accessible online tool.
![]()
forecast.id premium
Bring the full power of our National Forecasting Program into your organisation. We'll work with you to tailor a data partnership supported by briefings from our experts.
![]()
forecast.id partners
Our pay-per-download program gives our consulting partners instant access to reliable and respected forecast information on a project-by-project basis.
![]()
forecast.id hotspot report
Find a location near the people you serve with a tailored report that identifies up to ten locations with the highest number of people in your target demographic.
![]()
forecast.id location report
Whether you're investing in a new location or checking your current strategy is on track, forecast.id location reports quantify future demand around a known location.


.png?width=600&height=400&name=Meet%20the%20team%20%20Oliver%20Bowering%20(1).png)
