The population and housing forecast for the Perth - South West region

Read forecast analysis and insights for the Perth - South West region from Australia's largest independent population forecasting team.

Detailed forecasts are available for this region

Our premium services give you detailed forecast information for this region to help you invest in the right place, at the right time.

  • Forecasts by age and sex
  • Single-year forecast periods
  • Custom local area geography 
  • Forecasts of housing and development


Menu

Read the insights and analysis behind our population and dwellings forecasts for the Perth - South West region.

About the Perth - South West region

Spanning just over 48km north to south as the crow flies, the Perth - South West metropolitan region includes:

  • The City of Fremantle, the Town of East Fremantle, the City of Melville, the City of Cockburn, The City of Kwinana, and the City of Rockingham.
  • The region's highways create a torii gate shape, with the east/western Canning and Leach highways laid parallel to eachother at the northern end of the SA4, and the north/south Kwinana highway and Rockingham road running parallel from top to bottom.
  • The major trainlines servicing the region are the Mandurah Line, the Fremantle Line, and the soon to commence Thornlie-Cockburn Link connecting the Armadale Line to the Mandurah Line.
  • Similar to the other metropolitan Perth SA4s, the Perth - South West region includes both densely population inner city suburbs along with vast and expanding outer suburb growth areas.
  • The region includes both Rottnest and Garden Island.

Key findings

Three key players in the Perth - South West region's population and dwelling growth

The Perth - South West region's population and dwelling growth is dominated by three SA2s within the southern greenfield areas, however, significant growth is also expected within some built-up areas in the north. Over the forecast period, Perth - South West is expected to grow from 182,962 to 282,054 dwellings, an additional 100,000 dwellings by 2046.

The largest proportion of population growth at a local level belongs to Baldivis - North SA2, Casuarina - Wandi SA2, and Karnup SA2, contributing 34,200, 32,000, and 31,500 persons respectively, accounting for 44% of the region's total population growth to 2046. This growth is attributed to the significant number of residential dwellings identified within these areas over the forecast period. The large majority of dwellings identified are greenfield sites along the Kwinana highway in the form of developments that are under-construction in the short-term and state-government-identified areas for urban expansion in the long-term. Collectively, these three SA2s will contribute over 32% of Perth - South West's total dwelling growth to 2046.

Within the City of Cockburn, North Coogee SA2 and South Lake - Cockburn Central SA2 are also expected to experience significant population and dwelling growth, spearheaded by the medium and high-density residential developments on the historical North Coogee industrial precinct and surrounding Cockburn Central station respectively. High-density residential redevelopment has also been identified within the Canning Bridge Activity Centre precinct within the suburbs of Applecross and Mount Pleasant across the road. This activity centre structure plan is shared between Melville and South Perth City Councils, with a total of 4,300 additional dwellings expected on the Melville side by 2046. Significant development is also expected in Fremantle SA2 in the form of redevelopments in the city centre, with a total of 5,400 additional dwellings expected over the forecast period.

Rockingham SA2 and Melville SA2 are forecast to experience the most infill development in the 25 years to 2046, adding an additional 734 and 652 dwellings through infill development respectively.

Ten SA2s are expected to decline in population over the forecast period, the largest of which being Warnbro SA2 (-751), Cooloongup SA2 (-679), and Leeming SA2 (-594). 

What share of Australia's growth will occur in Perth - South West?

Read our forecast results and analysis for Western Australia to learn more about how the different drivers of population change affect the distribution of growth throughout the state.

Forecast results

The following forecast information is for the entire Perth - South West region.

Learn more about the different options to access these forecasts for Local Government Areas (LGAs), suburbs, custom catchments or the entire state or nation here.

2026 2031 2036 2041 2046

Forecast population

506,499

550,535

593,119

636,111

679,065

Change (five year)

47,496

44,037

42,584

42,992

42,953

Average annual change (%)

2.07%

1.74%

1.55%

1.45%

1.35%

Forecast dwellings

198,658

218,216

238,862

260,229

282,054

Change (five year)

15,696

19,559

20,646

21,367

21,825

Average annual change (%)

1.72%

1.97%

1.89%

1.79%

1.68%


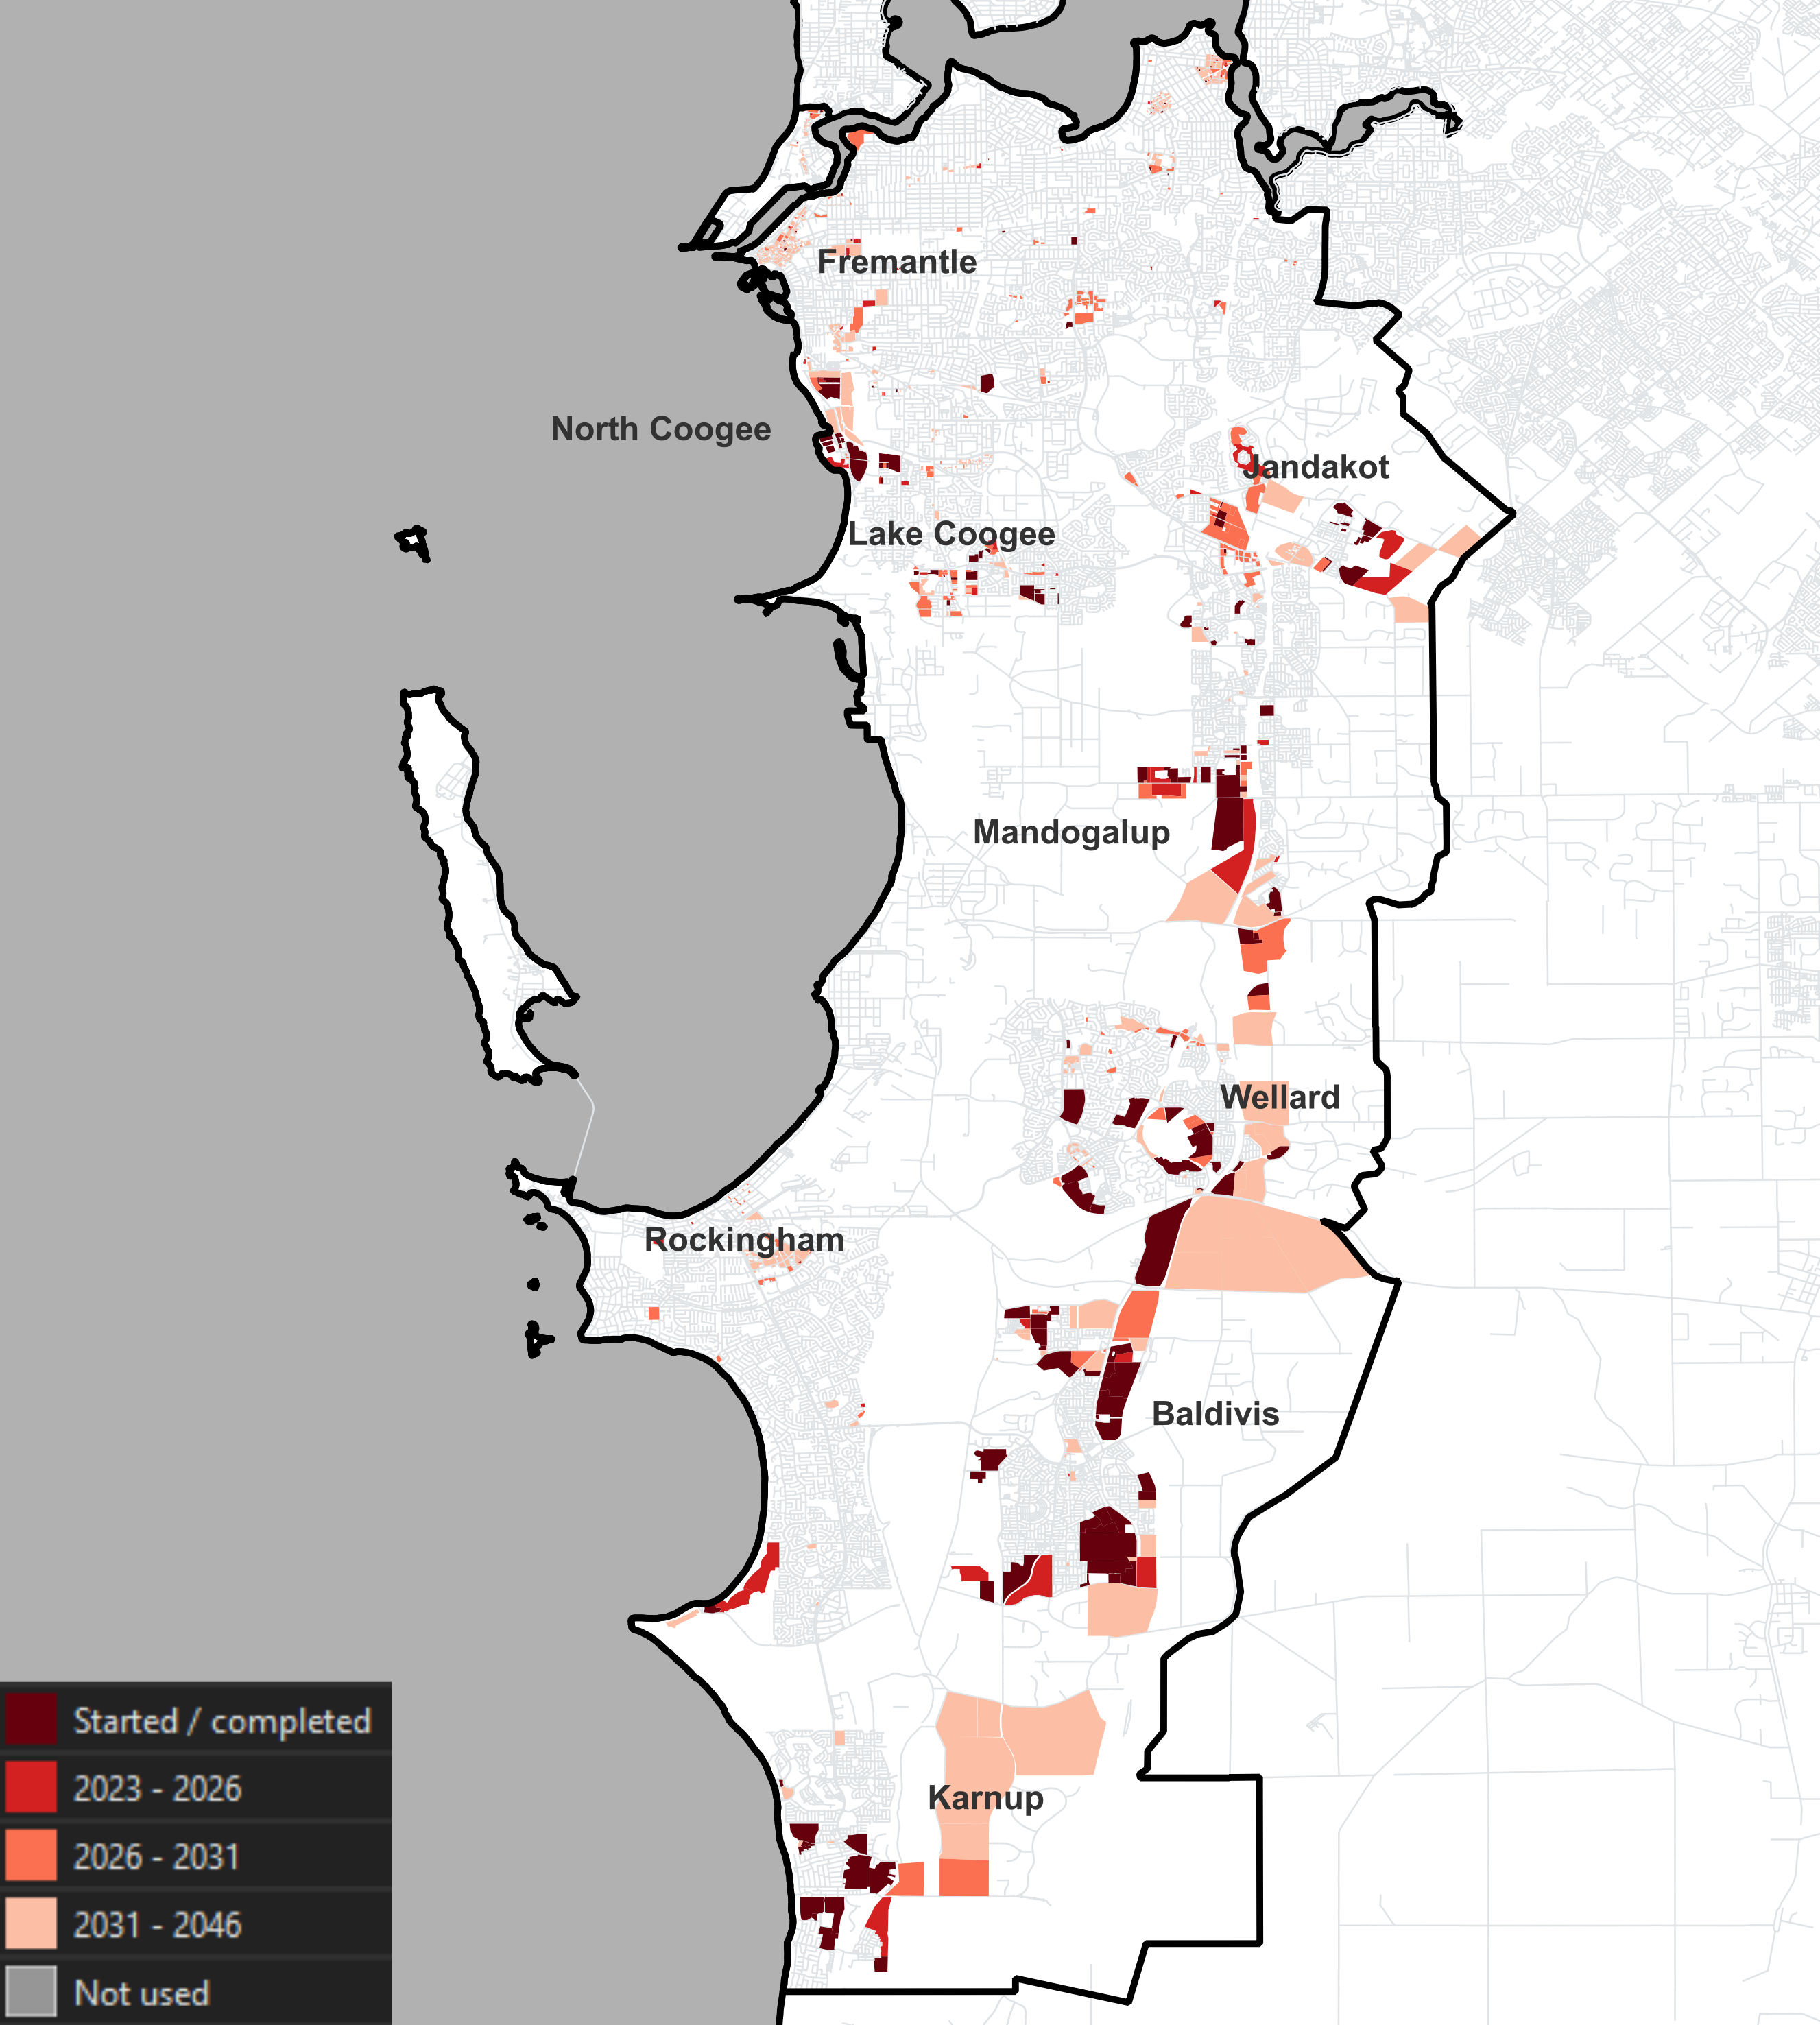
Map of development sites

The map below identifies all major development sites that have been identified in our research.

These sites have been organised to understand the likely location, capacity, timing and sequence of future development. By matching forecast population growth in this area to these sites, we can provide a more granular view of the distribution of the forecast population within a given region.

In the Perth - South West region, we identified 821 development sites, 81.1% of which were used in the forecast period.

Learn more about our land use research →

Development map  Perth South West


1 national forecasting program.

6 ways to explore.

lg-tag

forecast.id

Plan for the changing needs of your community with a trusted forecast of population and housing in your Local Government Area, published in an accessible online tool.

Learn more →

lg-tag

forecast.id catchments

Access detailed forecasts and powerful map-based reporting that helps your teams plan more effectively within and beyond your Local Government Area.

Learn more →

Services grid  Industry tile  Business (3)

forecast.id premium

Bring the full power of our National Forecasting Program into your organisation. We'll work with you to tailor a data partnership supported by briefings from our experts.

Learn more →

Services grid  Industry tile  Business (3)

forecast.id partners

Our pay-per-download program gives our consulting partners instant access to reliable and respected forecast information on a project-by-project basis.

Learn more →

Services grid  Industry tile  Business (3)

forecast.id hotspot report

Find a location near the people you serve with a tailored report that identifies up to ten locations with the highest number of people in your target demographic. 

Learn more

Services grid  Industry tile  Business (3)

forecast.id location report

Whether you're investing in a new location or checking your current strategy is on track, forecast.id location reports quantify future demand around a known location.

Learn more →

How to access our detailed forecasts

forecast.id provides detailed forecasts of population, housing and future development for local areas across Australia. 

✓ Detailed forecasts for local areas

Custom catchments

National coverage

Learn more about forecast.id and see access options here → 

Commentary and analysis from our specialist forecasters.

Johnny Barnard

Johnny Barnard

Principal forecaster
Liza Ivanova

Liza Ivanova

Population forecaster
Richard Thornton

Richard Thornton

Population forecaster
Chris_Jones

Chris Jones

Population forecaster
Oliver Bowering

Oliver Bowering

Population forecaster
john-o

John O'Leary

Forecast modelling