
Case Studies
The Client
Albury City and the City of Wodonga
The Challenge
Understand service provision for public transport across two local governments areas.
Response
Spatial analysis to identify areas outside public transport catchments and demographic analysis to understand residents of these areas compared to the overall region.
Outcome
Clear visualisation of public transport gaps and an understanding of the charateristics of residents within these gaps; all of which will be used to plan and advocate for meaningful service improvement.

Albury City and the City of Wodonga approached .id to help them understand the demographic characteristics of residents who live outside public transport catchments without reliable access to transport in their households. By conducting this analysis, the two councils could understand how the demographic differences of residents living outside public transport catchments and where councils would need to place their efforts to improve services and advocate for improvement.
This type of catchment analysis can be applied to a variety of service coverage assessments, such as understanding demand, usage and service coverage of parks and gardens, playgrounds and skateparks, sports grounds, swimming pool centres or community halls.
Methodology
We obtained public transport information from the two councils, geocoded the information then used network analysis to create public transport walking catchments (i.e. 400m walking catchments to bus stops). Once the isochrones are created, inverse spatial selections allowed for obtaining demographic information about those residents who live outside of the catchment areas. Different demographic datasets are obtained for those areas outside catchments and comparisons were made to illustrate how the demographic and socioeconomic characteristics of residents living outside public transport catchments compare to that of the entire LGA population in both Albury and Wodonga.
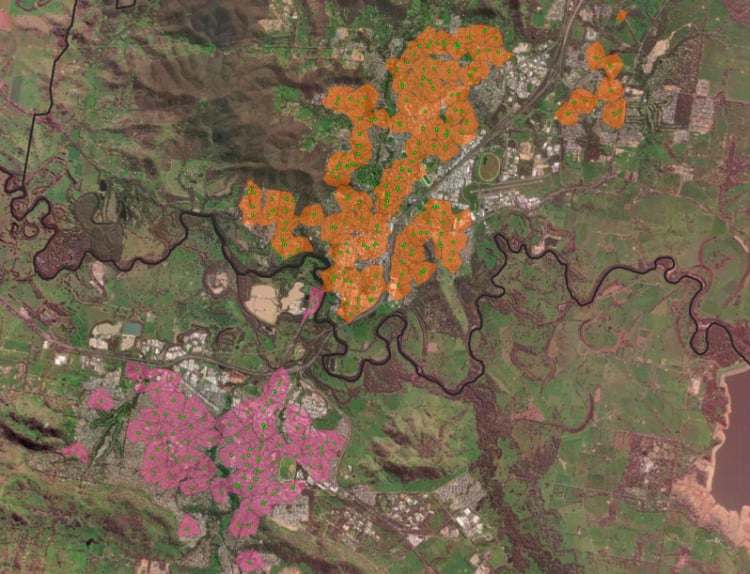
400m walking catchments to public transport stops in Albury City and the City of Wodonga
Results
Firstly, the analysis produced a visual understanding of which parts of the two LGAs are not well serviced by public transport. This is information the councils can use to advocate for coverage improvements.
Secondly, comparing the demographic characteristics of residents outside of public transport catchments to the entire LGA population revealed some interesting differences. We found these residents to be younger, with lower levels of university attendance and full-time employment than the LGAs as a whole.
The analysis also found that residents living outside public transport catchments had lower household incomes, were more ethnically diverse and had a higher need for assistance due to disability than all residents in the two respective LGAs.
Need help? Engage our demographic experts to inform your decisions.